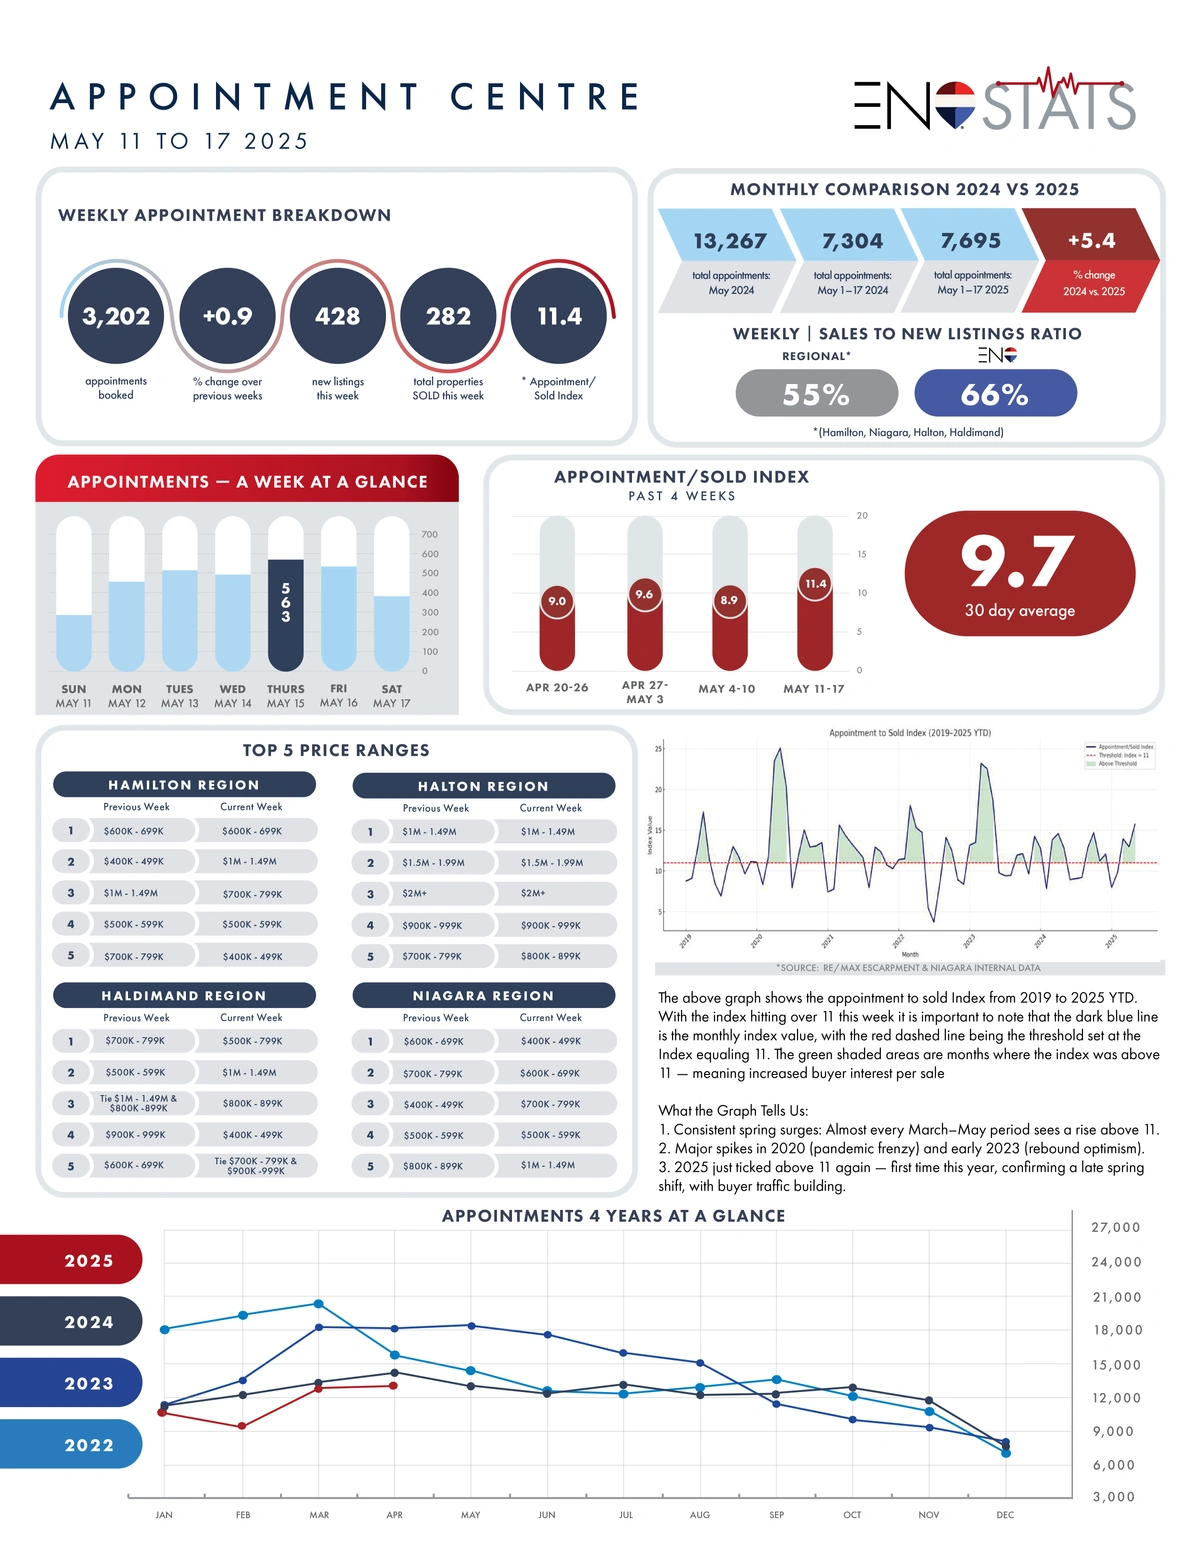
The above graph shows the appointment to sold Index from 2019 to 2025 YTD. With the index hitting over 11 this week it is important to note that the dark blue line is the monthly index value, with the red dashed line being the threshold set at the Index equaling 11. The green shaded areas are months where the index was above 11 — meaning increased buyer interest per sale
What the Graph Tells Us:
1. Consistent spring surges: Almost every March–May period sees a rise above 11.
2. Major spikes in 2020 (pandemic frenzy) and early 2023 (rebound optimism).
3. 2025 just ticked above 11 again — first time this year, confirming a late spring shift, with buyer traffic building.